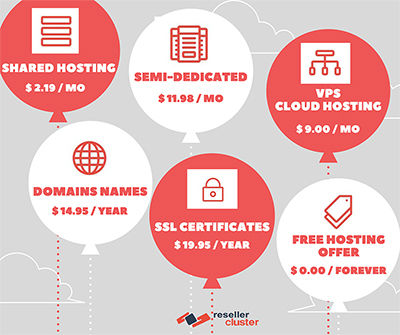
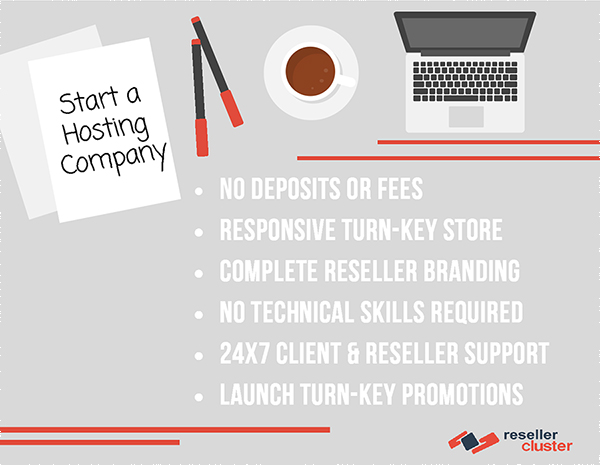
In the world of reselling hosting and web hosting in general, infographics can be life-savers. It’s no secret that the technical part in this area is harder to understand from people that are not really familiar with the web and how it works.
So, creating an infographic can easily explain and ease the process. But what is and how to create infographics? Let’s start with that.
What are the Infographics?
Infographics are a visual representation of information or data, as a chart, diagram or any other animation created. They can be used as blog content or helping presentations, reports, and etc.

Their main purpose is to help understand the information easily. When it comes to hard data, big numbers or just difficult to understand the material, infographics can really adjust it all to a simpler look.
Furthermore, it is well-known that the visual presentation is better assimilated by the human brain and people are more likely to remember what they saw with illustrations.
The use of infographics has risen enormously these days. A simple search in Google Trends can show that even as a keyword, the look for “infographics” has grown.
Truth is, creating them can help a lot for so much. It can tell a story that impels, it can increase the interest in content, it can help SEO, also reach much more people because they’re more likely to share this kind of content. I’ll look into every aspect of this and you’ll get to the best of how to create infographics.
How to Create Infographics – the Basics
-
Plan
Like any other thing, you need to start by getting all of your goals on point. Who are you trying to reach, what are you trying to achieve, what will be your focus.
Many people think that they first need an idea and they can decide everything else later. But truth is, more often the idea comes when you start thinking about the other questions before the idea itself.
Starting with who you want to get to, first do the audience segmentation. It helps clarify what you need to do, when it’s adjusted to the people it’s going to reach.
Furthermore, decide what is your final goal. Do you want to create just sharable content? Then your infographics can be more simple, public related, or maybe even fun. Are you trying to prove a point? Are going to a meeting with a presentation? Is your infographic going to be included in an e-book, a blog post or just an Instagram feed?
-
Idea
How to create infographics before you get your idea straight. You need to think of the content you’re going to share. But do it carefully.
Don’t pick topics that are too commercial and too often shared. It’s more probable to reach people who don’t like the infographics because of that. And if you are willing to do it anyway, at least pick an interesting way in order to stand out.
-
Story Telling
To learn how to create infographics you need to understand the need for a story in them. A simple statistic, chart or graphic is a dry, boring and dislikable in the world of marketing. People need to be interested, engaged, and understand the truth behind everything. To see the point.
This is why storytelling has worked so many times in different situations. But how to create infographics and also include storytelling? Truth is, you don’t have to create a long copy and make it difficult for people by engaging them with too much text.
Simply find a way to tell a lot with a little. That’s actually not quite that simple, but here are some tips:
First, choose one topic. Don’t go around a few problems, huffing readers. If you want to go with a few angles of it, then create a series of infographics. Different illustrations with different copy that fills the gaps, create a story, and get the final result.
-
Data Visualization
 To learn how to create infographics the best way, starting with the visual part is important. It is after all a visualization that we’re creating. But is it more important than the data itself? It’s like asking what came first – the egg or the chicken.
The data is valuable – it’s the reason you’re making an infographic. But how you present it is even more important. Miscommunication and misunderstanding are as powerful as any other impel. This means that not presenting your treasured data the right way can lead to crucial events.
Furthermore, good visualizing can be understood even by people that don’t understand the text. Let’s say you’re German who doesn’t speak Spanish and you look at a Spanish infographic that was visualized perfectly. The chances you understand the bigger part of it, are really high!
-
Ideas for Web Hosting
I started by sharing with you that it is way easier to reach people by creating infographics. The otherwise hard material gets simpler and even interesting. Start by creating graphics for the services and the prices you chose for them.
You can also share interesting facts about the industry in your blog or social media. An interesting approach is actually explaining technical details by creating infographics. If you have an FAQ page or tutorials, that’s another appropriate chance to place them.


How to Create Infographics and Improve SEO Ranking
SEO is a large topic that a lot of people keep talking about. Truth is, there are really a lot of things that can be done and in the end, most search engines just consider things we didn’t. However, I won’t talk about SEO, but in specific how to create infographics that will improve your ranking.
Of course, the first thing you need to do is find your keywords. Optimizing the infographic itself is possible by using keywords you did your research for before that. As well as posts and pages, there are a few on-page to-dos for optimization. Such as:
- Resolution
- The SEO title and file name
- Format & Size
- ALT text
Other Considerations
When learning about how to create infographics, you really need to keep in mind a lot of things. Starting with trustworthy information. Your data, copy, and statistics need to be triple-checked, confirmed, and of course, true. A misleading report is something you need to run fast from.
The length of the graphics also needs to be considered. Don’t create them too long and boring. Their main purpose is to ease the eye, not make it difficult to look at.
Colors, pictures, size. Please! If you don’t have the eye for these things, simply turn to an agency, creating infographics. This is something very smooth and you need to be careful. Don’t use too many colors, don’t over contrast them. Make sure everything has a balance and looks the right size.
When it comes to the text that is going to be on the infographics, as well as the truth in it, also make sure to check the spelling and the point. And just don’t use too much of it. No one will read it.
There isn’t much more about how to create infographics, except – have fun and don’t overthink! It’s something creative that is making our lives easier. Enjoy it.
